Managing Followed Services
In Spatineo Monitor each user organisation can indicate their interest in getting quality of service information on any services monitored by Spatineo Monitoring Agent Network, regardless of whether they are owners of those services or using them to drive their applications. Registering the interest in this information is called "following" a service. The list of followed services and their grouping as service groups are shared among all the user accounts of the same organisation.
After a service has been added to the followed services list, the users get to see the monitoring details on that service on the Monitoring & usage view. If the service is confirmed to be owned by the user's organisation (claimed), it's allowed to add and edit the meters and view the usage analytics of that service.
To claim a followed service as yours go to Service info tab of the Monitoring & usage section. The current owner of the service is indicated at the top of the Service info view. For unclaimed services the owner name is replaced with a link “not verified, click here if this is your service”. Clicking this link will start the claiming process. During the process you will need to download a special text file and transfer it to the web server hosting the specified service to ensure that you are in control of the service. If the self-service claiming cannot be completed or the service seems to be owned by someone else, please contact Spatineo support by email or by phone.
The number of followed services by a user or an organisation at a time may be limited for some of the Spatineo Monitor subscription types. Users can stop following a service by clicking the "Stop following service" link at the upper right corner of the Monitoring & usage view. The monitoring of the service will continue as before, but all alert indicators will be disabled when the service is no longer followed. If the user starts to follow the same service again later, the "use to trigger alerts" checkboxes in the alert settings of the services need to be checked on to start generating alerts.
Services and service groups
Followed services can be grouped into service groups for easier monitoring, reporting and management. The service groups may be organised in different ways depending on the needs of the users. Users may want to bind together a set of technologically similar services, services providing similar datasets, or services providing functionality for a certain application or web site etc. Each service may belong to any number of service groups.
The service grouping is used in different parts of the Spatineo Monitor:
- The services can be displayed one group at a time in the services list on the eft side of the Monitoring & usage view by selecting the group in the selector at the top of the list. All followed services are displayed again by clicking the "x" marker in the selector.
- The services are presented by groups in the Service dashboard view on the Overview & reports tab. The "Organize service groups.."-link in this view is the best way to add new groups, assign services to groups, and edit the display order of the services within the group.
- The maintenance announcements and other user community notifications can be easily assigned to all the services in a service group in the Notification publisher view of the Overview & reports tab.
- The service groups are used in creating combined reports of the monitoring and usage analytics results of all the services in each group.
Renaming services in Monitor
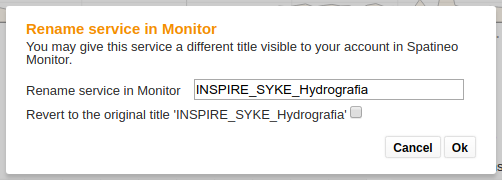
Sometimes the names of services can be confusing in Monitor. You might have multiple versions of the same service with the same name or maybe your server platform does not allow you to name services as you would like to. You can however rename the services in Spatineo Monitor. To do this, click the name of the service in Monitor and enter in the desired name as below.

Click the name of the service

Enter a new name or choose to revert back to the original name
Visibility of names
The name you enter here will only be visible within Spatineo Monitor, your reports and published widgets.
Spatineo Directory will always show the official name as reported by the service.
Dashboard: Overview of all followed services
The services dashboard under the Overview & reports tab provides a quick status overview of all services currently followed by the user's organisation. For each service having at least one service quality indicator, the overall service quality status, as well as the combined service quality status of each group, is indicated by a green/red traffic light style indicator. See [Configuring Indicators] on how to enable service quality indicators.
If there are more than 4 service groups, the dashboard is shown as paged. Clicking a service name in the dashboard will directly move you into the "Meters and alerts" view of that service. The service groups can be managed using the "Organize service groups.." -link below the group view on the right (see [Services and service groups]).
The Dashboard also shows the list of the latest alerts from all followed services
Finding and following interesting services
The best way to find interesting spatial web services to follow is searching them in the Spatineo Directory at http://directory.spatineo.com/ . The Spatineo Directory is a free service for anyone to use, and it contains basic information of all the services monitored by Spatineo. Every service page also contains a button "Follow in Spatineo Monitor" to add the current service as followed in your Spatineo Monitor account.
Sometimes it may happen that we don't yet know about your service. The video below shows you how to let us know about a new service using Spatineo Directory, and how to start following it in Spatineo Monitor.
Please note, that if your service requires authentication to access the service metadata (A.K.A. capabilities document), it cannot be automatically added to using the method described above. Please contact us by email at support(at)spatineo.com and we'll help you add your authenticated services to Spatineo Monitor.
Alternatively the service can be added inside the Spatineo Monitor by clicking the "Search for a service" widget and typing in words appearing the title of the service in question.
Advanced service setup
In some cases you may also want to force retrieving the service capabilities document to apply the changes made at the server configuration or network settings. This can be requested by clicking the “Refresh service” button in the service info tab.
Some web services only allow access to authorised users or require access only from specific web sites. The most typical way to enforcing user authentication and authorisation is using the so called Basic authentication method of HTTP 1.0 by requiring users to provide a valid username and password pair before returning the requested content (IETF RFC 7235: Hypertext Transfer Protocol (HTTP/1.1): Authentication, https://tools.ietf.org/html/rfc7235).
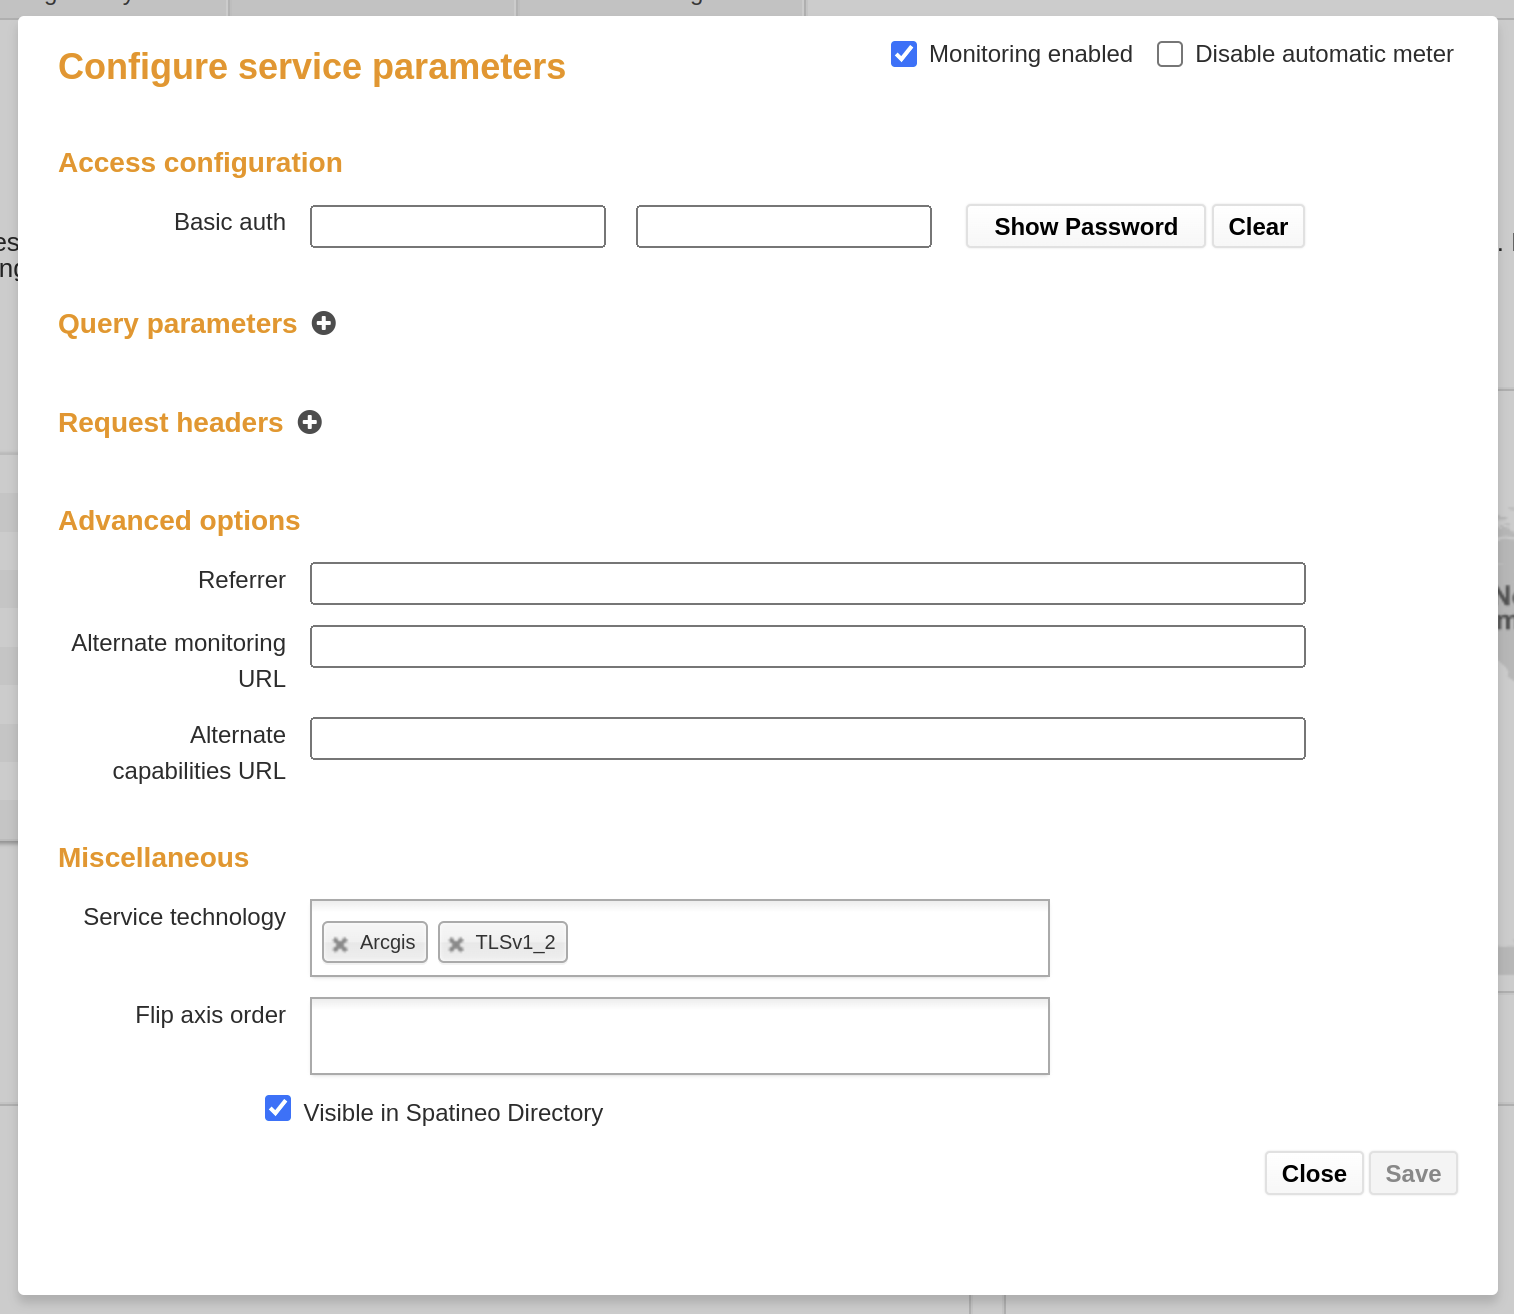
Other servers require specific HTTP query parameter name-value pairs or HTTP request headers to be set allowing access. To enable monitoring of this kind of protected services, select the service in question, go to the Service info tab and click the cogwheel button at top right corner of the view.

On this dialog you can configure the technical access details of the service including the HTTP authentication, custom query parameters and header values to be added to Spatineo monitoring requests and declare a fake HTTP referer header value (if the server only allows access from a specific web site). You can also override the HTTP URL addresses for accessing the service Capabilities document and for making the monitoring requests (GetMap, GetTile or GetFeature operations) given in the Capabilities document. The “Service technology” and the “Flip axis order” fields are only necessary in certain rare server configurations, and should not be changed in normal situations.
These settings also affect requests Spatineo Performance sends to the service
In addition to server access control settings, the Network settings dialog is used to forcing stopping of monitoring requests of a specific service (top center), disabling automatic metering of a service (top right) and controlling the visibility of the service information in the public Spatineo Directory search engine (bottom left).
Updated less than a minute ago
